Citynavigator Awards: The best tourism websites of 2020
On Thursday 23 January 2020, the National Citynavigator Awards were presented for the 3rd time during the annual Citynavigator Day. Some 80 destination marketing websites in the Netherlands are in the race for the 2019 "Oscars of the best tourism website": The Citynavigator Awards 2020.
The awards will be presented in the following categories:
- Best-viewed website of 2019
- Biggest increase in visitors compared to last year
- Best-viewed page of 2019
- Best visitor quality of 2019
All websites use the online platform Citynavigator.
17.7 million visitors in 2019
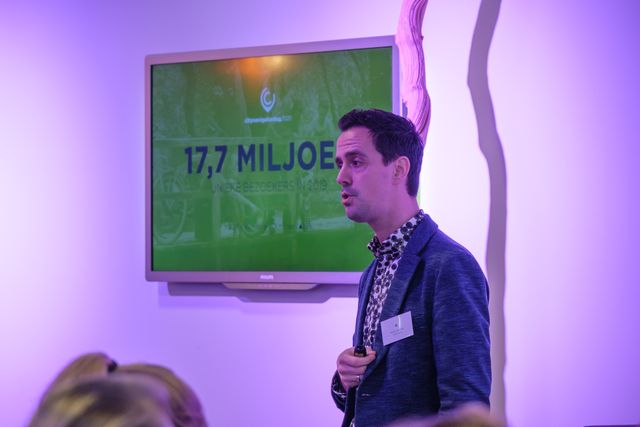
In 2019, 17.7 million visitors viewed participating tourism websites. That's a 25% increase compared to last year.
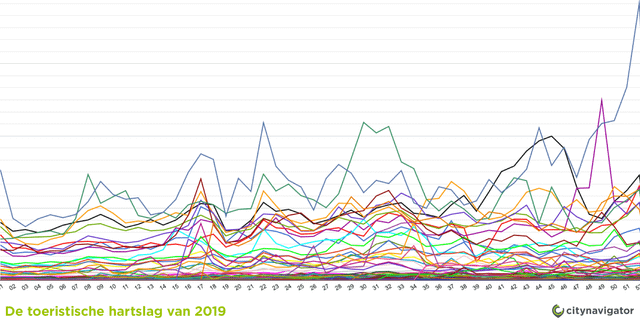
In total, they viewed some 60.6 million pages (up 16.5% on 2018).
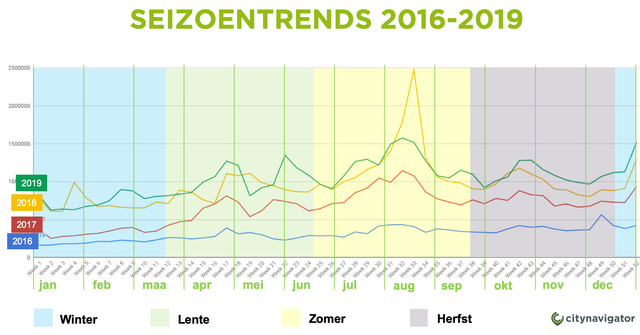
In recent years, we have seen more and more seasonal trends in online tourism. For example, around the month of August there is the traditional "summer holiday" rush (especially small cities and large areas see an increase in the number of online visits).
But in recent years, we have also seen online traffic increase in the period around the May holidays. The closing period at the end of the year has always been a crowd puller, but the many end-of-year events (Magical Maastricht, Fijne Feestdagen Festival and the various Christmas markets) ensure an extra rise in the number of online visitors.
61.8% of mobile visitors on destination websites
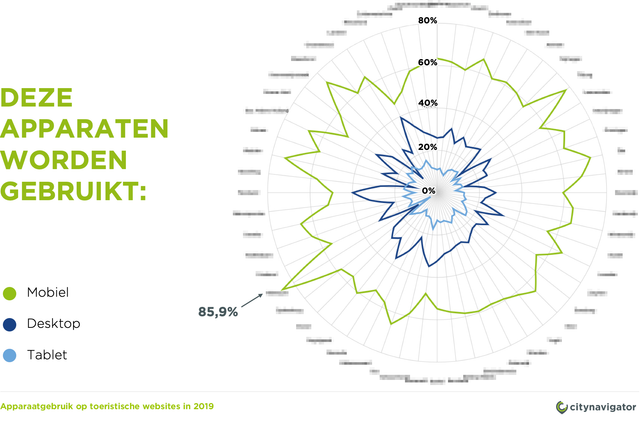
For years we have seen an increase in the use of mobile devices, and this trend continued in 2019. This year, 61.8% of all visitors viewed the destination website on a mobile phone. A desktop (or laptop) was used in only 28.8%. The tablet was the least used device at 12.4%.
Yet we see big differences between the various websites. Of particular note is the Hilversum website. As many as 85.9% viewed the website www.livehilversum.com on a smartphone.
Benchmark: a large city in the Netherlands has an average of 638,000 online visitors
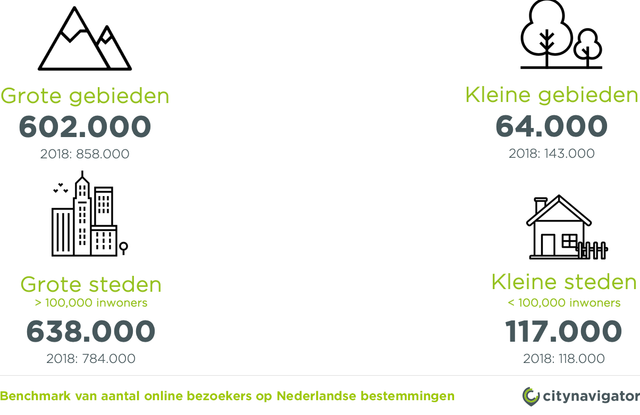
How many online visitors can you actually expect on your destination website? By comparing the statistics of around 80 tourism websites, we arrive at the following benchmark figures:
Number of online visitors per year
- Large areas
- Small areas: 64,000
- Large cities (over 100,000 inhabitants): 638,000
- Small cities (less than 100,000 inhabitants): 117,000

The audience at Citynavigator Day 2020 awaiting the presentation of the Citynavigator Awards
Best-viewed cities website of 2019: Maastricht and Noordwijk
Major cities
- Maastricht: https: //www.bezoekmaastricht.nl
- Eindhoven: https: //www.thisiseindhoven.com
- Utrecht: https: //www.bezoek-utrecht.nl
Small cities
- Noordwijk: https: //www.noordwijk.info
- Zutphen: https: //www.inzutphen.nl
- Winterswijk: https: //www.100procentwinterswijk.nl
Best-viewed area website of 2019: Drenthe and Green Heart
Large areas
- Drenthe: https: //www.drenthe.nl
- VisitBrabant: https: //www.visitbrabant.com
- Heuvelrug: https: //www.opdeheuvelrug.nl
Small areas
- Green Heart: https: //www.groenehart.nl
- Maashorst: https: //www.bezoekdemaashorst.nl
- Zuiderwaterlinie: https: //www.zuiderwaterlinie.nl
Biggest riser in 2019: Nijmegen, Vught, Veluwe and Landerd
Who did better than last year? Who attracted more unique online visitors than in 2018? We reward that website with the award for "Biggest riser in 2019".
Major cities
- VisitNijmegen +134%: https: //www.visitnijmegen.com
- VisitArnhem +104%: https: //www.visitarnhem.com
- Eindhoven +33%: https: //www.thisiseindhoven.com
Small cities:
- Vught +86%: https: //www.bezoekvught.nl
- Bernheze +81%: https: //www.bezoekbernheze.nl
- Doesburg +76%: https: //www.bezoek-doesburg.nl
Large areas
- Veluwe +75%: https: //www.visitveluwe.nl
- VisitBrabant +60%: https: //www.visitbrabant.com
- Heuvelrug +33%: https: //www.opdeheuvelrug.nl
Small areas
- Landerd +97%: https: //www.vvvlanderd.nl
- Zuiderwaterlinie +59%: https: //www.zuiderwaterlinie.nl
- Nieuwland National Park +56%: https: //www.nationaalparknieuwland.nl
Best-viewed page of 2019: VisitBrabant Uitagenda
Traditionally, the getaway pages are the most viewed pages on our destination websites. We no longer see the homepage in the top10 lists for a long time. Specific landing pages for target groups or themes are often much more viewed! This year it was also notable that more and more German-language websites penetrated the top "Most viewed page".
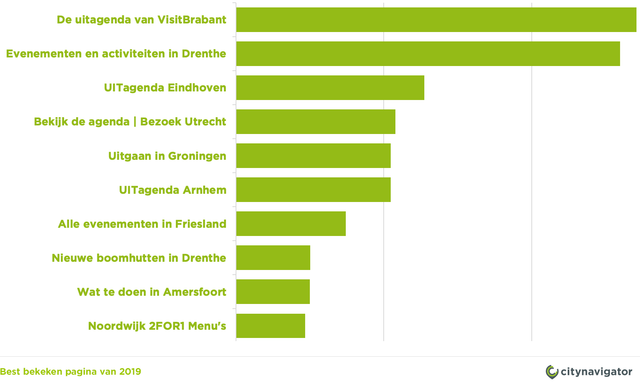
This year, the award for "Best viewed page of 2019" goes to VisitBrabant's getaway calendar, with a whopping 1.3 million page views.
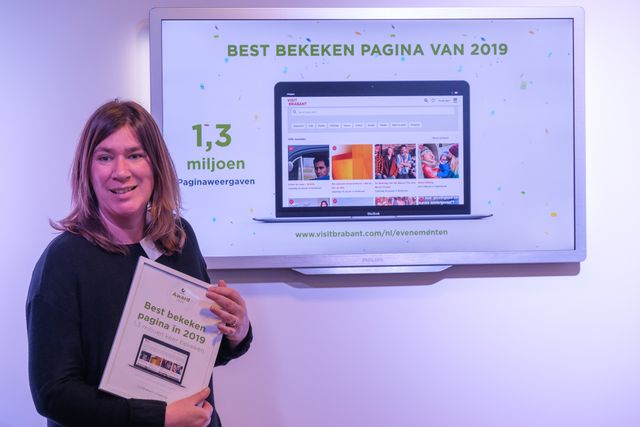
Rianne Leenders of VisitBrabant accepts the Citynavigator Award for "Best viewed page of 2019"
Best online visitor quality of 2019: VisitLeeuwarden
For the first time, the award was presented for the destination website that best captivates its visitor.
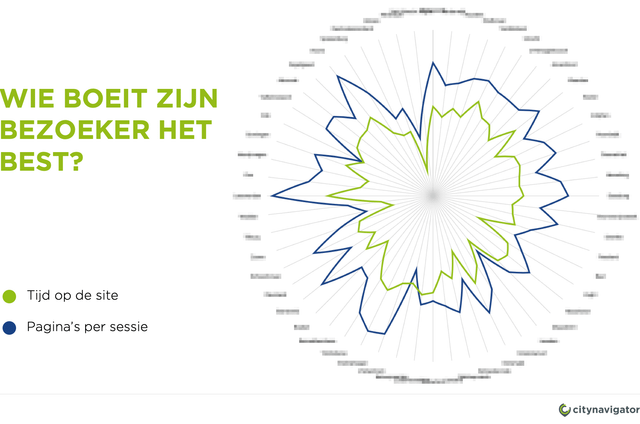
It looks at the average time a visitor spends on the site and how many pages he views during his visit. Across both criteria, www.visitleeuwarden.com scored best, winning the award for "Best online visitor quality in 2019".
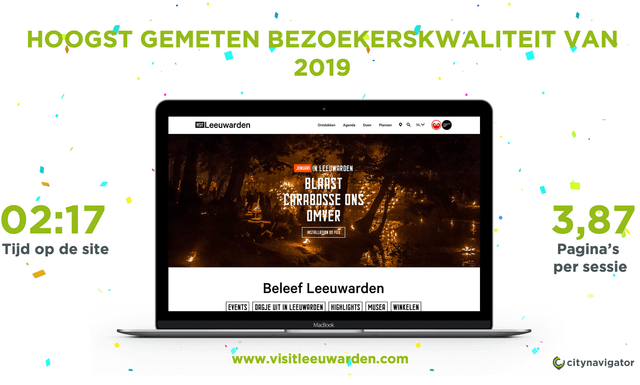
On average, a visitor spent 2 minutes and 17 seconds on the site and viewed 3.87 pages during their visit.
See you next year!
Next year during the Citynavigator Day, the awards will be presented again. Do you want to be there? Register now via: info@plaece.nl/en