
Content quality: how good is your data?
Of course, a good website relies heavily on good content. Knowledge of your destination is key. Good data to support you as a website manager is very important. But what data do you actually have available? And how good is that data? How can that data help you do even better? In this article, we will give you some tips and opportunities to do more with your data.
Content:
Relevant content on the website: give visitors what they want!
The majority of your visitors arrive at your website via Google. They come in via a search term and expect to find what they are looking for straight away. Many times, the visitor lands on a relevant page (most likely a landing page). The homepage is also still one of the most visited pages. So how can you make sure that your visitors are happy with that page and find what they are looking for?
Use data to make informed choices
How do you make sure you put the most important topics in the right place? For that, you can use data. Data you can collect fairly easily:
- Top tasks: Ask what your visitors come for
- Statistical analysis: see what your visitors do

Top tasks: ask what your visitors come for
The easiest way to find out what content your visitors find most interesting is to ask them. For this purpose, we have developed the toptask survey. With this survey, we ask your website visitors which topics they visit on the website. Once there are enough respondents, we can make an analysis of the most sought-after topics. Based on this data source, you can compile the top tasks for your website (or page).
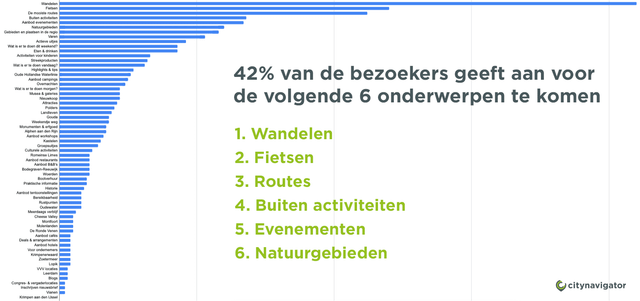
The above example shows the top tasks of a medium-sized region in the Netherlands. The top tasks according to the respondents are:
- Hiking
- Cycling
- Routes
- Outside activities
- Events
- Natural areas
These 6 topics are what 42% of visitors are looking for. So that also means they are NOT looking for the other 58%...
For most regions in the Netherlands, the above topics are the most sought-after. For cities and villages, the emphasis is obviously different. By using these top tasks on your website, you can lead your visitors directly to the content they are (most likely!) looking for. So make sure these top tasks are as prominent as possible on your pages. Are you already using the Hero pagepart? That will really help them.
Curious about the top tasks of your destination? We would be happy to help you with a top task survey.
Statistical analysis: see what your visitors do
Chances are your website is linked to Google Analytics. With Google Analytics, it is very easy to see which pages on your website are "most popular". An advantage of this method is that you can quickly see which pages are the most viewed (e.g. number of page views), but a big disadvantage is that you therefore don't know what you are "missing". After all, something that is not (or difficult) to find on your website cannot be viewed. So we also recommend always adding a toptask or keyword research to your statistics analysis.
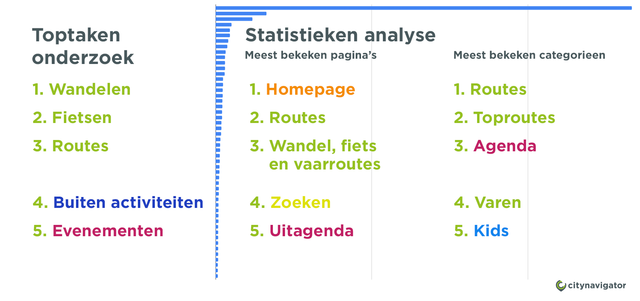
Based on both the results of the toptask survey and the statistical analysis, you know what your visitors are interested in. Based on this data, you can start optimising your pages.
Are you putting data to work for your website?
Curious about the possibilities and results of a toptask survey or statistics analysis? We will be happy to tell you more about it
Quality of data in Base
The content on your website is largely enriched with data from Base. Whether it concerns hotels, restaurants, accommodation, routes or events; all tourist data is available in Base. But how "good" is this data really? Is the content up to date? Is the content rich enough? Is the data available in multiple languages? To find out, we have developed something new: the Base 0 measurement.
The Base 0 measurement
By means of a one-off report, we can map and analyse the state of the data in your own Base. You will gain insight into "how well" your data is filled in various areas. Below, we explain the various possibilities.
Is my data available in multiple languages?
As an international destination, it is obviously important that all data in the Base is available in several languages. You can decide for yourself which languages you want to make available in Base. In the first report, you can see "per item type" (locations, events, deals, routes) how many items have actually been translated.
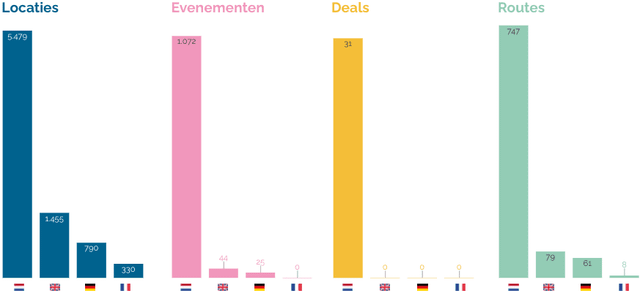
In the example above, you can see that only 27% of all venues and only 4% of all events are translated into English.
In Base, you can set your own filter, allowing you to view all items that have no translation available for a specific language.
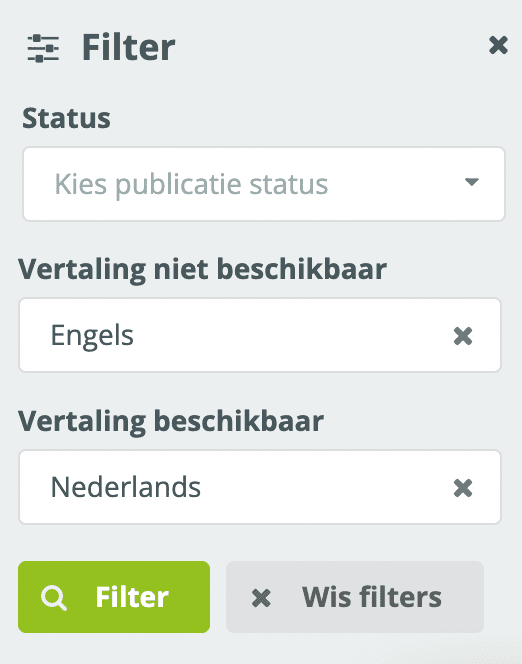
This way, it is possible to give the multilingual offer on your website a major upgrade! Looking for help with translating your data? Contact us, we will be happy to help!
Is my data complete?
The richer your data is, the more you can do with it and the better you help your visitors. In the report below, you can see per item type (per language) whether the most important content is filled:
Locations & events
- Short description
- Long description
- Postcode
- Website
- Call-to-action
Deals & packages
- Short description
- Long description
- Call-to-action
Routes
- Short description
- Long description
- Distance
- Duration
- GPX
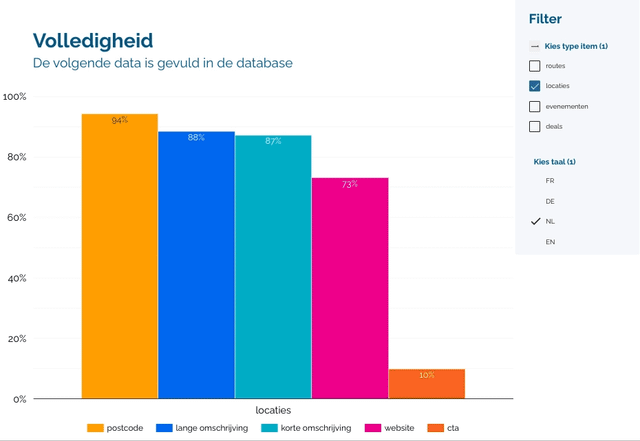
The reporting is expandable with specific extra content. Would you like to know, for example, how often the itinerary is filled? Or perhaps the telephone number? We can easily add this information for you in your own report.
This report gives you quick insight into the completeness of your data. Want to know which items are missing which information? Using an export, we can tell you exactly which items are not yet complete.
Is my data up to date?
The fresher your data, the more valuable it is. If an item has not been updated for three years, chances are the data is no longer current. Perhaps opening hours have changed, the interior has changed appearance or there are changes in the entrepreneur's offer. So it is important to keep your data as up-to-date as possible. The report below shows per item type (per language) how long ago the content was last updated.
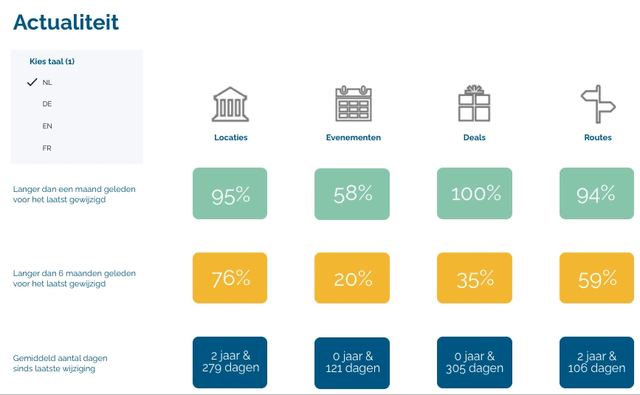
In the example above, you can see that 95% of Dutch locations were last changed more than a month ago. 76% have even been changed more than 6 months ago! The average number of days since the last change is almost 3 years!
Take action: get your data right!
We understand that you are busy and that it is quite labour-intensive to keep everything up to date. The Base 0 measurement gives you the insights to see how healthy your data is right now. Want to make a change? We'd love to help! Our team of content editors can help you bring your data up to date and give it a big quality boost.
Would you also like a 0-masurement of your data?
We can carry out a one-off 0 measurement for you. You get an interactive dashboard in which you can see for yourself the health of your data in Base. You will also receive an analysis from us on how to improve your content. If you wish, we can also carry out a benchmark, how healthy your data is compared to similar destinations. Would you like a repeat measurement at regular intervals? That is of course also possible. Do you have any questions or interest? Please contact us. We will gladly help you