
Crowd control based on tourism and leisure density of the Netherlands
In places where there are many tourism entrepreneurs and activities, there is a good chance that potential hotspots arise in terms of crowds. A heatmap makes it easy to map these hotspots.
All locations in the plaece.base (or other external data source) can be shown on a map. By generating a heatmap of this, it is possible to see where the density is highest. This could be in the city centre, for example, but also in certain rural areas. Once you know where most (tourist) activities take place, you can also determine more specifically where you do/don't want to direct visitors in terms of visitor distribution and crowd management.
View the Map Tourist Density Netherlands on:
https://heatmap.plaece.nl
The Tourism and Recreation Density Map of the Netherlands shows where the tourism and recreation operators in the Netherlands are located.
We looked at all the data in the Base platforms of our DMOs in the Netherlands, from the Wadden to Maastricht. We literally mapped more than 200 large and small destinations in the Netherlands. In this way, we can show where the density of tourism operators is the highest. So in the current situation with all the Corona measures, these could be potential hotspots where it could get busy.
A number of similar initiatives have been circulating for some time, but no one had yet mapped the density for the whole of the Netherlands. Since we already have a large part of the Netherlands in our database, it seemed logical to us to tackle this nationwide. We therefore call on everyone to make their data available as well, so that we can really work towards national coverage. The data source is already directly applicable for all crowd managers in the Netherlands. We are making this heatmap available free of charge for everyone to use.
In the background, we are working hard to develop this further. Think for example of filtering by "Type of tourism". So you can see at a glance where the most accommodation is located. And does that match the places for popular day recreation? So where can you as DMO spot opportunities?
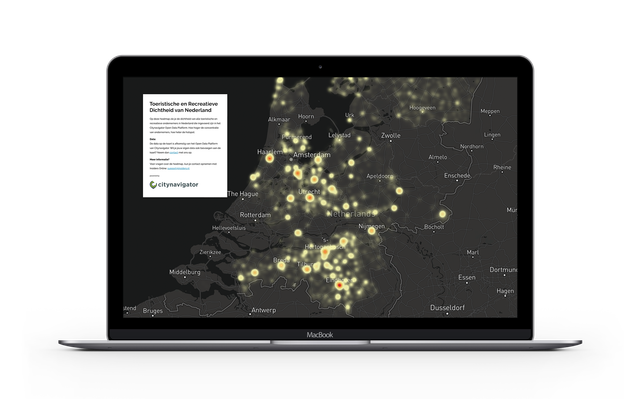
Map overview with the density of all tourism operators in the Netherlands
Further developments
If new data sources become available (think of real-time pressure reports, or the occupancy rate of parking garages), we can combine these data and make them available as an extra map layer. Or what about segmenting all tourism operators based on Lifestyles? So then you can immediately see whether your offer matches your brand strategy.
This way, we slowly work towards a tool that can be widely used in the field of crowd management, brand compass and even policy-making.
View the Map Tourist Density Netherlands on:
The map Tourist Density Netherlands
- Shows all (tourist) activities and entrepreneurs on the map
- Zoom in on areas to see where the hotspots are
- Map contains out-of-the-box data from all connected Plaece partners (100+ destinations in the Netherlands)
- Link external data sources of non-plaece partners for national coverage