
Data Visualiser
Share insights and results visually with partners and stakeholders.
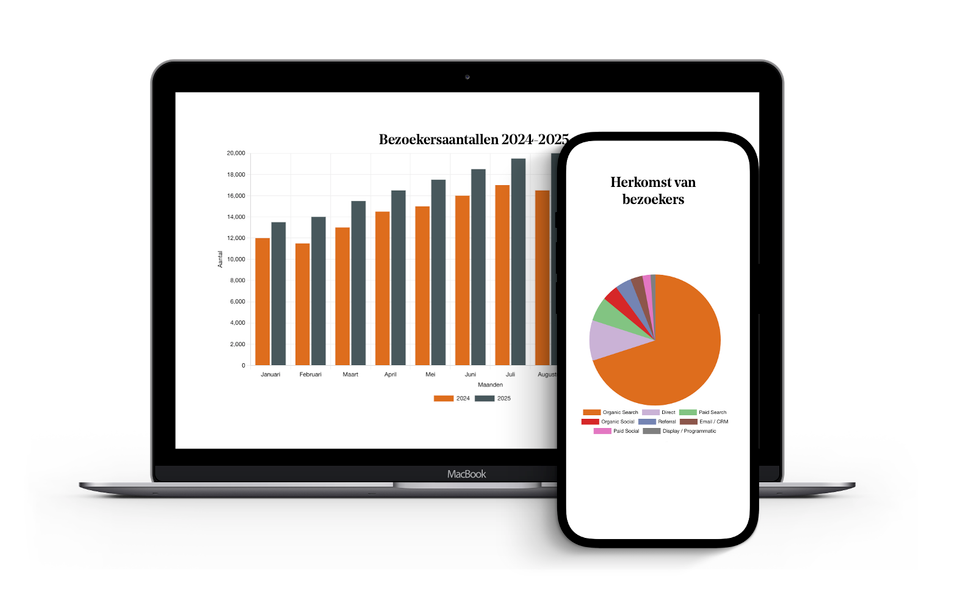
Presenting annual figures to a local council, a county council or another funding body. This is often done using a PowerPoint presentation or a PDF that nobody can ever find again. Yet these figures actually demonstrate the results of your work as a DMO: how many visitors, where they come from, and how your social media is growing. That deserves a better platform.
With the data visualiser page part, you can convert figures into clear charts, directly on your website. You upload an Excel file, choose the chart type, and set the colours and design so that everything matches your corporate identity. Bar charts, pie charts, line charts: you decide what best suits the data you want to display.
The results appear on the page of your choice. No standalone dashboard, no external tool, no link you first have to explain. The figures are simply displayed exactly where your partners, stakeholders or funders expect to find them: visible, understandable and professional.
This makes accountability a great deal simpler. But it also works the other way round: a DMO that openly demonstrates the benefits a destination delivers builds trust – with local authorities, with businesses, and with anyone who wants to know whether the partnership is delivering results.
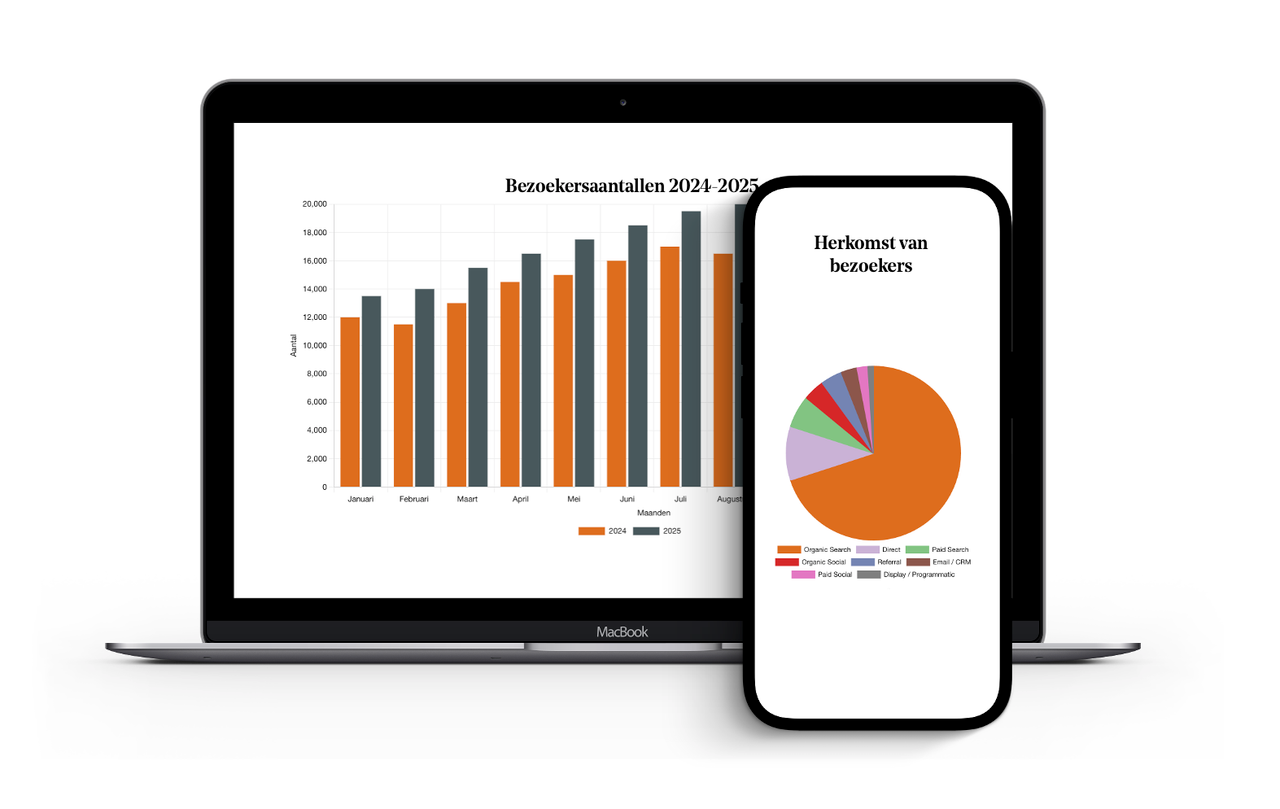
This results in the data visualiser ‘pagepart’
- Figures are instantly converted into clear graphs on your own website
- Suitable for bar charts, pie charts and line charts
- Fully customisable to match your corporate identity in terms of colour and design
- Easy to upload via an Excel file; no technical knowledge required
- Can be placed on any page, from annual reports to partnership pages
- Makes accountability to local authorities, regional authorities and funders concrete and visual
- Builds trust with partners through transparency regarding results